About:
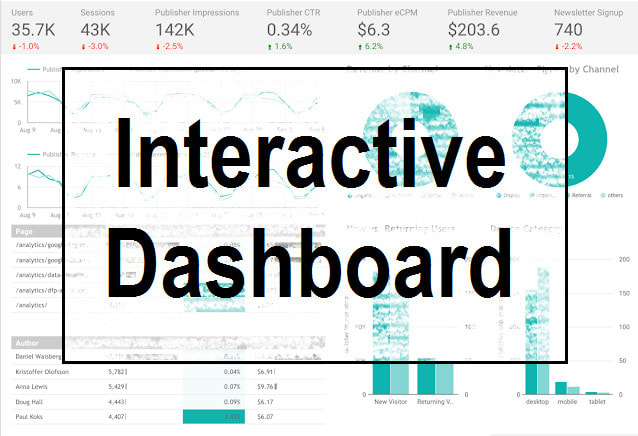
Do you have a lot of data, but you are a little bit confused about what to do with it and how can it help you to make right decisions for your business? Then this gig is for you.I will analyze your data and create an interactive dashboard/report which represents your sales, inventory movement, etc.
Data visualizations such as bars, maps, lines, waterfalls, slicers, etc. will be used which allows to create easy-to-understand reports.
On the Basic and Standard packages I will create dashboards and adding your account to view them, while the Premium package allows you to update data every day, month, etc. by yourself so the dashboard/report is reflecting on the latest information.
Feel free to contact me if you have any questions.
Reviews
: : : : :

No comments:
Post a Comment