About:
I will create an excel MI dashboard with analytics and commentary highlighting trends and patterns in your business. The dashboard will be semi-automated – only data needs to be updated. You will have a clear view of your business performance.
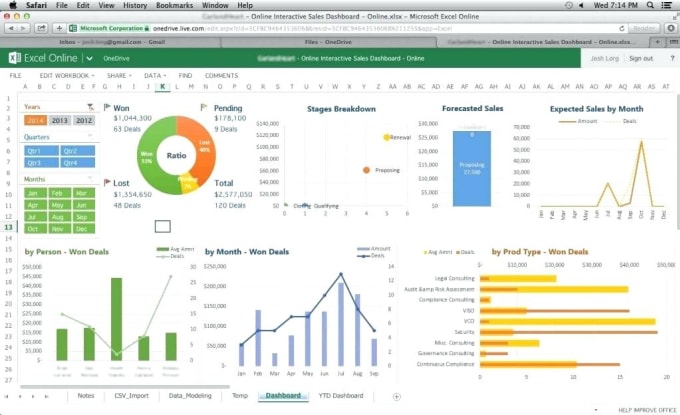
Key dashboard features:
- Daily, weekly, monthly and yearly charts and trend analysis
- Summary dashboard tab to give an overall view of data
- Targets to gauge performance
- Dashboard automated with formulas
- Charts and graphs neatly designed and presentation-ready
- Instructions provided for ease of use
- Compatible with Excel 2007 and later versions
- Works both on Windows and Mac
Custom service provided to design the dashboard according to your business requirements. Please message me before placing the order, so that I am in the best position to provide you an exceptional service.
Having built MI dashboards and reports for a top global bank, I've gained years of hands-on experience at capturing requirements and building effective dashboards to highlight business performance.
Reviews
Seller's Response:
Helped to create an easily scalable dashboard that not only I can use but my Clients can as well
Seller's Response:It was a pleasure working for the buyer. Thank you for the support and guidance. I hope we can collaborate again in the future.
Seller's Response:Analyst24 was great! Will definitely use again!
Seller's Response:A pleasant experience working with the buyer. Thank you for instructing clearly and I'm happy we were able to create a very good dashboard. I look forward to working together again and providing any support needed in the future. Thank you!
Seller's Response:Good Communication
No comments:
Post a Comment