About:
Gig Includes:
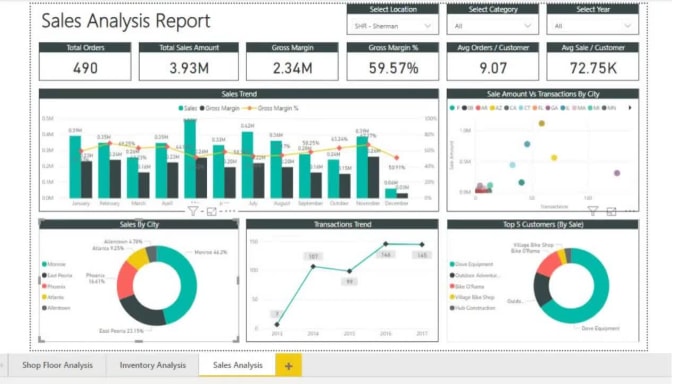
Data Visualization ,Dashboard and Reports using Power BI
Pull and Transform Data from any data source supported by Power BI (Excel, Pdf, CSV, Sql, Mysql, Access etc).
Using DAX Functions to make Data Available for interactive and Appealing Visuals
Create Interactive visuals like Graphs, Maps Charts and Reports.
Create Professional Dashboards and reports with great Data visualization including Filters Cards to make it Attractive.
Troubleshoot and fix any issue related to Power BI.
Publish Reports to Power BI Service.
And Lot More
Please contact me before placing an order.
Reviews
Seller's Response:
Tariq was very professional and patient, he asked the right questions to make sure he understood the requirements for my Dashboard. I'll definitely work with him again!
Seller's Response:Tariq had done a great job and made changes according to requests. He made a good data visualisation based on region and geography and understood my requirements. Thank you so much!
Seller's Response:Thanks,Hope to see you again,Enjoyed working with you.
Seller's Response:Great work. Excellent result!
:Thanks,Hope to see you with another project
No comments:
Post a Comment