About:
Gig Includes:
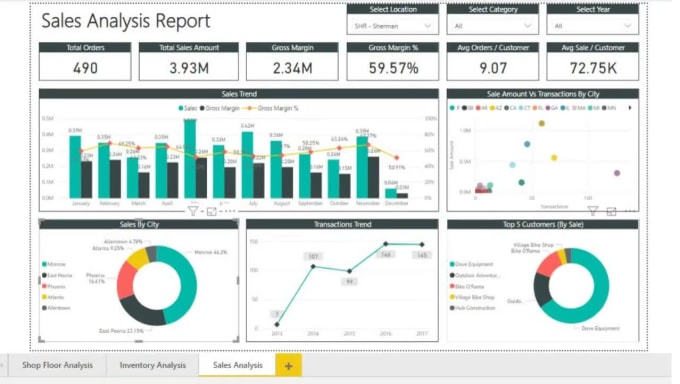
Data Visualization ,Dashboard and Reports using Power BI
Pull and Transform Data from any data source supported by Power
BI (Excel, Pdf, CSV, Sql, Mysql, Access etc).
Using DAX Functions to make Data Available for interactive and Appealing Visuals
Create Interactive visuals like Graphs, Maps Charts and Reports.
Create Professional Dashboards and reports with great Data visualization including Filters Cards to make it Attractive.
Troubleshoot and fix any issue related to Power BI.
Publish Reports to Power BI Service.
And Lot More
Please contact me before placing an order.
Reviews
Seller's Response:
Good job, he offers a video as tutorial if you need to understand some features or the process . Good job
Seller's Response:Tariq Ali is very professional and very attentive to his clients' needs He is also very efficient. His mastery of Power Bi and data visualisation more broadly makes him a very good person to work with. He delivered two jobs for me and I was very happy with the end products. Would recommend to anyone who needs data visualisation jobs done using Power Bi.
Seller's Response:Thanks,Hope to work with you in future .
Seller's Response:He will do further projects with me for sure . Good quality and good intention on helping with details
:Thanks,I am available for your help.
No comments:
Post a Comment