About:
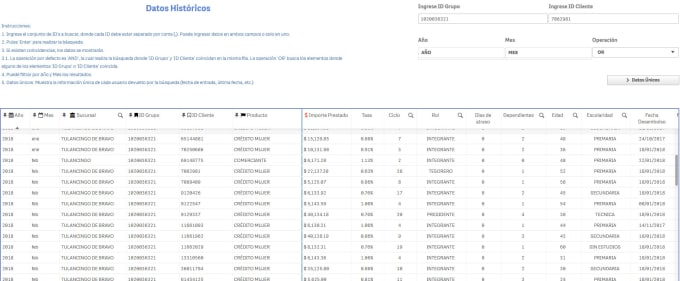
If you need to create charts for a dashboard in qlik sense, I will offer you the construction of such charts. I am an expert in visualization on Qlik Sense, with the native objects, as well as with added extensions. I can also create visualizations with Vizlib, an external library to Qlik Sense, but it creates a superior visual experience to Qlik's native graphics.Extensive Qlik Sense project experience as well as advanced data analysis and analytics.
I will offer you up to 5 Qlik sense chart visualizations
Reviews
: : : : :
No comments:
Post a Comment